The Beginning of the End of Rising Volatility
Alongside reduced class-based voting, partisan de-alignment and the rise of populism, rising electoral volatility has become an axiom of analyses of elections in Western Europe. There is certainly a wealth of evidence that electoral volatility has been on the rise. Compared to the two previous decades electoral volatility in the 2010’s was significantly higher. 12 Western European countries have experienced record levels of volatility at elections since 2010 compared to just four countries whose records were reached in the previous decade. At six elections since 2010 electoral volatility (the absolute sum of changes in party support at an election divided by two) has exceeded 30 compared to just two elections in the preceding 24 years. In Greece in May 2012 and France in 2017 electoral volatility exceeded 40. These dramatic figures compelled the leading scholar of the subject to describe the 2010’s as the ‘the most electorally turbulent decade ever’ https://twitter.com/Vinceman86/status/1206538494497214464.
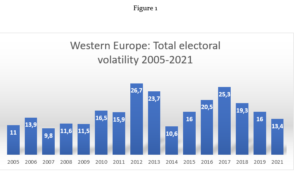
There is a growing body of evidence, however, that electoral volatility in Western Europe has peaked and is on a firm downward trend. First, annual average numbers for electoral volatility (see Figure 1) have been falling since 2017. In only one year since 2010 (2014) has average electoral volatility been lower than it was in 2021. This is not simply the result of where the most recent elections were held. The Dutch election of March 2021 saw the countries lowest volatility for nine general elections spanning 32 years and the German election of October 2021 was the least volatile for 14 years.
Figure 1.
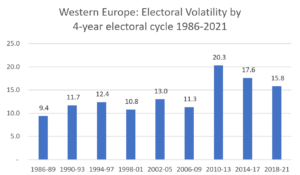
A second way to illustrate these trends is to consider figures over electoral cycles. Most Western European countries hold general elections on four-year cycles. Analysing data back to 1986 allows us to compare figures for volatility across nine electoral cycles (see Figure 2). The total number of elections held in these cycles ranged from 16 in the period 1998-2001, to 23 in the period 1986-89 with an average of 19 per cycle. The picture is one of remarkable stability across the six electoral cycles from 1986 to 2013, followed by a large increase between 2010 and 2013 and then falls in each successive cycle from 2014. The fall in the two most recent cycles is remarkable given that seven countries experienced record levels of volatility in those periods.
Figure 2.
What is driving this apparent reversal of the previous trend of rising electoral volatility? Two elections with the very high figures for volatility – Greece in May 2012 (48.5) and Italy in 2017 (36.7) provide a clue. In both cases more than 80% of the total volatility was so-called ‘within block’ volatility – movement of voters between parties with broadly similar ideological positions – rather than cross block or ‘cleavage’ volatility with movements of voters across ideological groups. Parties of both the mainstream left and right lost support heavily to new competitors on their respective ideological territories.
If we compare cleavage and within-block volatility in the most recent electoral cycle (2018-21) with the peak cycle for electoral volatility (2010-13) we find that a substantial decline in within-block electoral volatility accounts for almost all the decline in total volatility between the two cycles. While cleavage volatility fell just 4.8% between the two cycles, within-block volatility fell by more than a fifth, 22.5%. Two key questions are suggested by this comparison.
First whether the major realignment on the left of European politics occasioned by the financial crash has largely played itself out to be replaced by a new electoral stability? A comparison of vote shifts for social democratic parties across the same two electoral cycles does suggest that this may be happening. Between 2010-13 the vote change of social democratic parties in Western Europe averaged 6.7% and on average contributed 17% of the total volatility at general elections. In the period 2018-21, however, the average vote change of social democratic parties more than halved to just 3.0% and changes in the vote share of social democratic parties accounted for just 9.2% of total volatility.
Second, whether radical right parties have largely become institutionalized and stable players within the party systems of Western Europe? The evidence suggests that this has not happened and that radical right parties may actually be accounting for an increased share of the total volatility that is occurring. The average change in vote share of radical right parties during the two electoral cycles – 4.9% and 5.0% – was virtually unchanged, meaning that the contribution of vote changes of radical right parties to total volatility actually increased from 12.4% to 15.2%.
Whilst evidence suggests that electoral volatility in Western Europe is now on a downward trend, levels of volatility whether measured by year or electoral cycle, still remain high by historic levels. The current electoral cycle, which kicks off with the Portuguese election of January 2022 and includes scheduled elections in all West European countries, will provide the data to test whether, in post-pandemic conditions, the political realignment of Western Europe continues and new forms of closure of electorates have emerged.